Composition / Intermediate
Stacked Bar Chart
Compare category totals and the contributions that make them up.
Interactive Chart Preview
JAVASCRIPTEdit the column names and values to update your chart. Changes stay in this page until you reload.
| Row# | Category | Value | Value | Value | Remove row |
|---|---|---|---|---|---|
| 1 | |||||
| 2 | |||||
| 3 | |||||
| 4 |
Use distinct names and nonnegative values in the same units. Each row sums to its category total. Zeros are valid; blank cells are not. Up to 20 series; fewer are easier to read.
Chart.js Code Example
JAVASCRIPTimport Chart from 'chart.js/auto';
// Illustrative data used by the live preview.
const chartData = {
"categoryLabel": "Topic",
"labels": [
"Setup",
"Billing",
"Access",
"Exports"
],
"datasets": [
{
"label": "Email",
"data": [
42,
58,
35,
27
],
"backgroundColor": "#3b82f6",
"borderColor": "#3b82f6",
"borderWidth": 1
},
{
"label": "Chat",
"data": [
63,
47,
52,
31
],
"backgroundColor": "#0d9488",
"borderColor": "#0d9488",
"borderWidth": 1
},
{
"label": "Phone",
"data": [
18,
25,
14,
9
],
"backgroundColor": "#d97706",
"borderColor": "#d97706",
"borderWidth": 1
}
]
};
function createConfig(chartData) {
return {
type: 'bar',
data: {
labels: chartData.labels,
datasets: chartData.datasets.map(series => ({
label: series.label,
data: [...series.data],
backgroundColor: series.backgroundColor,
borderColor: series.borderColor,
borderWidth: 1,
})),
},
options: {
responsive: true,
maintainAspectRatio: false,
plugins: {
legend: { position: 'bottom' },
tooltip: { mode: 'index', intersect: false },
},
scales: {
x: { stacked: true, title: { display: true, text: chartData.categoryLabel }, grid: { display: false } },
y: { stacked: true, beginAtZero: true, title: { display: true, text: 'Value' } },
},
},
};
}
const chart = new Chart(document.getElementById('myChart'), createConfig(chartData));Preview and code follow the same library selection.
Run This Example
Install the package below in a browser project such as Vite. Put the copied code in a client JavaScript module and add this container to the page before the module runs.
npm install chart.js@4.5.1<div style="height:320px"><canvas id="myChart"></canvas></div>The example includes its sample data. When removing the chart, destroy or dispose of its instance and disconnect any resize observer.
Reading This Example
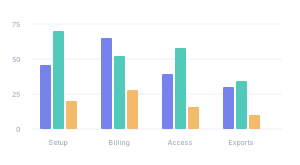
This illustrative example stacks Email, Chat, and Phone ticket counts within each topic. The totals are 123 for Setup, 130 for Billing, 101 for Access, and 67 for Exports. Billing has the largest total, although Setup has the largest Chat count at 63. Every ticket belongs to one topic and one channel in this example.
All library tabs use these illustrative values. Rendering styles and library APIs differ, so use the table to compare exact numbers.
About this example & sample data
| Topic | Chat | Phone | |
|---|---|---|---|
| Setup | 42 | 63 | 18 |
| Billing | 58 | 47 | 25 |
| Access | 35 | 52 | 14 |
| Exports | 27 | 31 | 9 |
READ THE CHART
Read the Total and Its Parts
A stacked bar chart places contributions on top of one another. The full bar height shows the category total, while each segment shows one part. Use it when both total size and composition matter.
Make the Parts Add Up
Use nonnegative values in a common unit. Each item should belong to only one part if you intend the stack to represent a count of distinct items. Overlapping groups count some items twice, and percentages with different denominators do not form a meaningful total.
Read Segment Length, Not Its Top Edge
Only the first series starts at zero. The top of a later segment includes the values beneath it, so its position is not its individual value. Use the tooltip or data table for exact values. Grouped bars are easier when comparing individual series across categories is the main task.
Keep Order and Zero Values Explicit
Series stack from the first numeric column upward in the same order for every category. Zero contributions have no height, and a row of zeros has no visible bar. This example accepts nonnegative values only; a chart of gains and losses needs a separately defined baseline and stacking rule.
Separate Totals From Shares
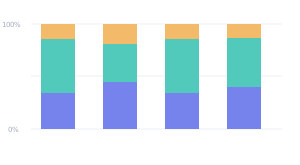
These bars keep their original units. A taller bar means a larger total, not necessarily a larger share for every series. Use a percentage view when the question is about composition regardless of total size. The Seaborn example applies its theme to Matplotlib bars with cumulative starting positions.
KEEP EXPLORING