Composition / Intermediate
100% Stacked Bar Chart
Compare percentage composition across categories with different totals.
Interactive Chart Preview
JAVASCRIPTEdit the column names and values to update your chart. Changes stay in this page until you reload.
| Row# | Category | Value | Value | Value | Remove row |
|---|---|---|---|---|---|
| 1 | |||||
| 2 | |||||
| 3 | |||||
| 4 |
Enter nonnegative raw values in the same units. Each positive row total becomes 100%. Zero-total rows are labeled No total. Fill every cell and use distinct names. Up to 20 series.
Chart.js Code Example
JAVASCRIPTimport Chart from 'chart.js/auto';
// Illustrative data used by the live preview.
const chartData = {
"categoryLabel": "Topic",
"labels": [
"Setup",
"Billing",
"Access",
"Exports"
],
"datasets": [
{
"label": "Email",
"data": [
42,
58,
35,
27
],
"backgroundColor": "#3b82f6",
"borderColor": "#3b82f6",
"borderWidth": 1
},
{
"label": "Chat",
"data": [
63,
47,
52,
31
],
"backgroundColor": "#0d9488",
"borderColor": "#0d9488",
"borderWidth": 1
},
{
"label": "Phone",
"data": [
18,
25,
14,
9
],
"backgroundColor": "#d97706",
"borderColor": "#d97706",
"borderWidth": 1
}
]
};
function createConfig(chartData) {
const totals = (chartData.labels ?? []).map((_, index) => chartData.datasets.reduce((sum, series) => sum + series.data[index], 0));
return {
type: 'bar',
data: {
labels: chartData.labels?.map((label, index) => totals[index] > 0 ? label : `${label} (No total)`),
datasets: chartData.datasets.map(series => ({
label: series.label,
data: series.data.map((value, index) => totals[index] > 0 ? value / totals[index] * 100 : 0),
backgroundColor: series.backgroundColor,
borderColor: series.borderColor,
borderWidth: 1,
})),
},
options: {
responsive: true,
maintainAspectRatio: false,
plugins: {
// All series stay visible so the full row remains the denominator.
legend: { position: 'bottom', onClick: () => { } },
tooltip: {
mode: 'index', intersect: false,
callbacks: {
label: context => {
const raw = chartData.datasets[context.datasetIndex].data[context.dataIndex];
return totals[context.dataIndex] > 0
? `${context.dataset.label}: ${raw} (${Number(context.raw).toFixed(1)}%)`
: `${context.dataset.label}: ${raw} (share unavailable)`;
},
footer: items => items.length ? `Total: ${totals[items[0].dataIndex]}` : '',
},
},
},
scales: {
x: { stacked: true, title: { display: true, text: chartData.categoryLabel }, grid: { display: false } },
y: { stacked: true, min: 0, max: 100, title: { display: true, text: 'Share (%)' }, ticks: { callback: value => `${value}%` } },
},
},
};
}
const chart = new Chart(document.getElementById('myChart'), createConfig(chartData));Preview and code follow the same library selection.
Run This Example
Install the package below in a browser project such as Vite. Put the copied code in a client JavaScript module and add this container to the page before the module runs.
npm install chart.js@4.5.1<div style="height:320px"><canvas id="myChart"></canvas></div>The example includes its sample data. When removing the chart, destroy or dispose of its instance and disconnect any resize observer.
Reading This Example
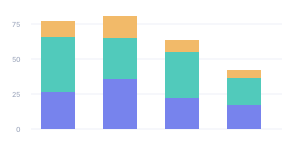
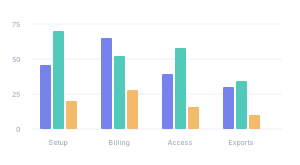
This illustrative example normalizes the same ticket counts used by the Grouped Bar and Stacked Bar pages. Setup totals 123 tickets, with 63 Chat tickets making up about 51.2%. Exports totals only 67 tickets, with 31 Chat tickets making up about 46.3%. Both bars reach 100%, even though their ticket totals differ.
All library tabs use these illustrative values. Rendering styles and library APIs differ, so use the table to compare exact numbers.
About this example & sample data
| Topic | Chat | Phone | |
|---|---|---|---|
| Setup | 42 | 63 | 18 |
| Billing | 58 | 47 | 25 |
| Access | 35 | 52 | 14 |
| Exports | 27 | 31 | 9 |
READ THE CHART
Compare the Mix Within Each Category
A 100% stacked bar chart gives every positive-total category the same height. Each segment shows its share of that category’s total, making differences in composition easier to compare when group sizes differ.
Start With Raw Values
Enter one nonnegative value per category and series. The example divides each value by its row total and multiplies by 100. It keeps full precision for drawing and rounds only tooltip percentages. The editor, sample table, and copied data preserve the original values.
Keep the Denominator Visible
Hover over a JavaScript segment to see its raw value, share, and category total. The legend identifies series and keeps them all visible. Removing a series from the editor changes the row total and recalculates all remaining shares, so it changes the question being answered.
Treat Zero Totals as Undefined Shares
A row of zeros has no denominator. It is labeled No total and has no visible bar, rather than being filled to 100%. A zero contribution within a positive total is a valid 0% share. Missing cells are invalid drafts and keep the last valid preview until corrected.
Keep Absolute Size in Mind
Equal bar heights hide differences in total size. Use a stacked bar chart when totals matter, or grouped bars to compare individual raw values on a common baseline. Each observation should belong to one part; overlapping categories can create misleading shares. The Seaborn example uses its theme with Matplotlib stacking.
KEEP EXPLORING