FROM QUESTION TO CHART
Choose With Confidence
Start with what you want to learn. Find a useful chart, understand its limits, and try a working example.
What Do You Want to Show?
6 category guides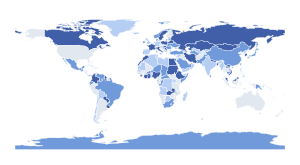
Choosing a Geographic Chart
Choose a Choropleth Map for regional values or a Bubble Map for locations. Compare rates, totals, circle areas, missing data, and projection limits.
Read guide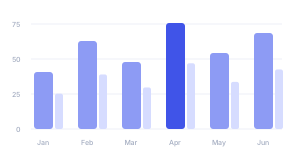
Choosing a Comparison Chart
Compare categories, paired values, targets, balances, and process stages. Choose among bars, Dumbbell, Slope, Bullet, Waterfall, Funnel, and Radar.
Read guide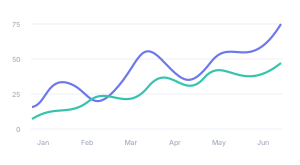
Choosing a Trend Chart
Choose Line, Area, Stacked Area, Candlestick, or Gantt for ordered values and intervals. Understand baselines, session spacing, and elapsed time.
Read guide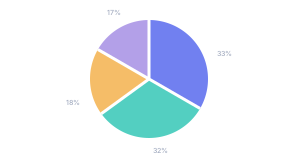
Choosing a Composition Chart
Compare Pie, Donut, stacked bars, Treemap, and Sunburst for parts of a whole. Keep denominators and nested totals clear without double counting.
Read guide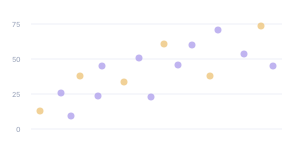
Choosing a Relationship Chart
Choose Scatter, Bubble, Heatmap, Sankey, Chord, or Network. Distinguish paired measurements, directed flows, weighted pairs, and simple connections.
Read guide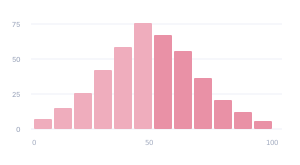
Choosing a Distribution Chart
Compare Histogram, Box Plot, Density, Violin, and Beeswarm. Match counts, summaries, or raw observations to a view of spread and concentration.
Read guideChoosing Between Two Charts?
Side-by-side decisionsCHART COMPARISON
Bar Chart vs Histogram
A bar chart compares categories; a histogram groups numeric observations into intervals. See how the same order data can answer two questions.
Compare the options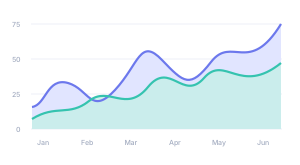
CHART COMPARISON
Line Chart vs Area Chart
Compare line and area charts using the same monthly values. Learn when a fill helps, how baselines matter, and why area is not a running total.
Compare the options