Comparison / Beginner
Grouped Bar Chart
Compare multiple series side by side within each category.
Interactive Chart Preview
JAVASCRIPTEdit the column names and values to update your chart. Changes stay in this page until you reload.
| Row# | Category | Value | Value | Value | Remove row |
|---|---|---|---|---|---|
| 1 | |||||
| 2 | |||||
| 3 | |||||
| 4 |
Use distinct category and series names, with the same units across series. Signed values, decimals, and zeros are supported. Fill every cell. Up to 20 series; fewer are easier to compare.
Chart.js Code Example
JAVASCRIPTimport Chart from 'chart.js/auto';
// Illustrative data used by the live preview.
const chartData = {
"categoryLabel": "Topic",
"labels": [
"Setup",
"Billing",
"Access",
"Exports"
],
"datasets": [
{
"label": "Email",
"data": [
42,
58,
35,
27
],
"backgroundColor": "#3b82f6",
"borderColor": "#3b82f6",
"borderWidth": 1
},
{
"label": "Chat",
"data": [
63,
47,
52,
31
],
"backgroundColor": "#0d9488",
"borderColor": "#0d9488",
"borderWidth": 1
},
{
"label": "Phone",
"data": [
18,
25,
14,
9
],
"backgroundColor": "#d97706",
"borderColor": "#d97706",
"borderWidth": 1
}
]
};
function createConfig(chartData) {
return {
type: 'bar',
data: {
labels: chartData.labels,
datasets: chartData.datasets.map(series => ({
label: series.label,
data: [...series.data],
backgroundColor: series.backgroundColor,
borderColor: series.borderColor,
borderWidth: 1,
})),
},
options: {
responsive: true,
maintainAspectRatio: false,
plugins: {
legend: { position: 'bottom' },
tooltip: { mode: 'index', intersect: false },
},
scales: {
x: { stacked: false, title: { display: true, text: chartData.categoryLabel }, grid: { display: false } },
y: { stacked: false, beginAtZero: true, title: { display: true, text: 'Value' } },
},
},
};
}
const chart = new Chart(document.getElementById('myChart'), createConfig(chartData));Preview and code follow the same library selection.
Run This Example
Install the package below in a browser project such as Vite. Put the copied code in a client JavaScript module and add this container to the page before the module runs.
npm install chart.js@4.5.1<div style="height:320px"><canvas id="myChart"></canvas></div>The example includes its sample data. When removing the chart, destroy or dispose of its instance and disconnect any resize observer.
Reading This Example
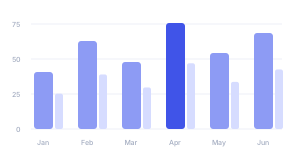
This illustrative example compares support ticket counts for Email, Chat, and Phone across four topics. Setup has 42 Email, 63 Chat, and 18 Phone tickets. Chat is the largest channel for three topics; Email leads Billing with 58 tickets compared with 47 for Chat and 25 for Phone. Each bar shows a count, not a percentage or stacked total.
All library tabs use these illustrative values. Rendering styles and library APIs differ, so use the table to compare exact numbers.
About this example & sample data
| Topic | Chat | Phone | |
|---|---|---|---|
| Setup | 42 | 63 | 18 |
| Billing | 58 | 47 | 25 |
| Access | 35 | 52 | 14 |
| Exports | 27 | 31 | 9 |
READ THE CHART
Compare Series Side by Side
A grouped bar chart, also called a clustered bar chart, places related bars beside each other within each category. Each bar starts at zero on the same value scale, so you can compare series within a group and follow one series across groups.
Use Comparable Values
Put categories in the first column and one series in each remaining column. All series need the same units and comparable coverage. Counts from a full month should not be compared with counts from one week without explaining the difference.
Keep the Grouping Consistent
Read each group from left to right in the same series order as the table and legend. Keep category order consistent, too. A stable position helps readers follow a series without relying on color alone. Hover over the JavaScript bars or open the sample table to inspect exact values.
Keep Zero and Missing Data Separate
A zero is a known value and gives the bar no height. An empty cell means the value is missing, so this editor preserves the last valid chart until you fill it. Negative values extend below zero. Keep the zero baseline visible so bar lengths remain comparable.
Limit the Number of Comparisons
The editor allows up to 20 series and 200 categories, but a few series across a small set of categories are easier to read. Use a heatmap when the matrix becomes crowded, a bar chart for one series, or a line chart when the main question is change over an ordered sequence.
KEEP EXPLORING