Comparison / Beginner
Bar Chart
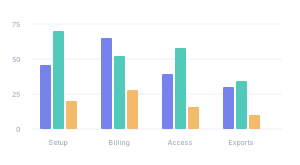
Compare discrete categories with rectangular bars.
Interactive Chart Preview
JAVASCRIPTEdit the column names and values to update your chart. Changes stay in this page until you reload.
| Row# | Category | Number | Remove row |
|---|---|---|---|
| 1 | |||
| 2 | |||
| 3 | |||
| 4 | |||
| 5 |
All values are valid. Negative values and decimals are supported.
Chart.js Code Example
JAVASCRIPTimport Chart from 'chart.js/auto';
// Illustrative data used by the live preview.
const chartData = {
"categoryLabel": "Month",
"labels": [
"Jan",
"Feb",
"Mar",
"Apr",
"May"
],
"datasets": [
{
"label": "Sales",
"data": [
12,
19,
3,
5,
2
],
"backgroundColor": "rgba(59, 130, 246, 0.8)",
"borderColor": "rgb(59, 130, 246)",
"borderWidth": 1
}
]
};
function createConfig(chartData) {
let chartType = 'bar';
let options = {
responsive: true,
maintainAspectRatio: false,
plugins: {
legend: {
position: 'bottom',
},
tooltip: {
mode: 'index',
intersect: false,
},
},
};
chartType = 'bar';
options.scales = {
y: {
beginAtZero: true,
title: { display: true, text: chartData.datasets[0].label },
grid: { color: 'rgba(0, 0, 0, 0.1)' },
},
x: {
grid: { display: false },
title: { display: true, text: chartData.categoryLabel },
},
};
return { type: chartType, data: structuredClone(chartData), options };
}
const chart = new Chart(document.getElementById('myChart'), createConfig(chartData));Preview and code follow the same library selection.
Run This Example
Install the package below in a browser project such as Vite. Put the copied code in a client JavaScript module and add this container to the page before the module runs.
npm install chart.js@4.5.1<div style="height:320px"><canvas id="myChart"></canvas></div>The example includes its sample data. When removing the chart, destroy or dispose of its instance and disconnect any resize observer.
Reading This Example
This illustrative example compares sales across five months. February has the largest value (19), and May has the smallest (2). The values are sample data with no currency or unit specified.
All library tabs use these illustrative values. Rendering styles and library APIs differ, so use the table to compare exact numbers.
About this example & sample data
| Month | Sales |
|---|---|
| Jan | 12 |
| Feb | 19 |
| Mar | 3 |
| Apr | 5 |
| May | 2 |
READ THE CHART
A Clear Comparison at a Glance
A bar chart compares values across categories. Each bar starts from a common baseline, so its length makes differences easy to see. Use one when your reader needs to compare, rank, or find the largest and smallest values.
Choose the Right Data
Start with a category and a numeric value for each bar: products and sales, teams and scores, or months and totals. Use consistent units so the lengths are comparable.
Make Comparisons Honest
Start the value axis at zero. Truncating the baseline can exaggerate differences in bar length. Keep bars the same width and leave space between discrete categories.
Let the Order Do Some Work
Sort categories by value when ranking matters. Keep a natural order for months or other sequences. For long category names, horizontal bars give labels more room.
Know When to Switch
Choose a line chart when the trend over time matters more than individual totals. Use a histogram to show how continuous measurements are distributed across numeric ranges.
KEEP EXPLORING