Comparison / Intermediate
Bullet Chart
Compare actual values with targets and reference ranges.
Interactive Chart Preview
JAVASCRIPTEdit the column names and values to update your chart. Changes stay in this page until you reload.
| Row# | Category | Value | Value | Value | Value | Value | Remove row |
|---|---|---|---|---|---|---|---|
| 1 | |||||||
| 2 | |||||||
| 3 |
Use the same units throughout. Enter nonnegative actuals and targets, then three increasing or equal range ends, with a positive final end. Values may exceed the ranges. Fill every cell and use distinct metric and column names.
Chart.js Code Example
JAVASCRIPTimport Chart from 'chart.js/auto';
// Illustrative data used by the live preview.
const chartData = {
"categoryLabel": "Team",
"labels": [
"Setup",
"Billing",
"Access"
],
"datasets": [
{
"label": "Actual (Tasks)",
"data": [
84,
67,
92
],
"backgroundColor": "#3b82f6"
},
{
"label": "Target (Tasks)",
"data": [
90,
75,
85
],
"backgroundColor": "#0f172a"
},
{
"label": "Range 1 End",
"data": [
60,
50,
60
],
"backgroundColor": "#cbd5e1"
},
{
"label": "Range 2 End",
"data": [
80,
70,
80
],
"backgroundColor": "#e2e8f0"
},
{
"label": "Range 3 End",
"data": [
100,
100,
100
],
"backgroundColor": "#f1f5f9"
}
]
};
function createConfig(chartData) {
const labels = chartData.labels;
const names = chartData.datasets.map(series => series.label);
const values = chartData.datasets.map(series => series.data);
const maximum = Math.max(...values.flat()) * 1.05;
return {
type: 'bar',
data: { labels, datasets: [
...[4, 3, 2].map((column, index) => ({ label: names[column], data: values[column], backgroundColor: ['#f1f5f9', '#e2e8f0', '#cbd5e1'][index], grouped: false, order: 3 - index, categoryPercentage: 0.8, barPercentage: 1, maxBarThickness: 30 })),
{ label: names[0], data: values[0], backgroundColor: '#3b82f6', grouped: false, order: 0, categoryPercentage: 0.8, barPercentage: 0.35, maxBarThickness: 10 },
] },
plugins: [{ id: 'target-marks', afterDatasetsDraw: chart => {
const ctx = chart.ctx;
const half = Math.min(12, (chart.chartArea.bottom - chart.chartArea.top) / labels.length * 0.3);
ctx.save();
ctx.strokeStyle = '#0f172a';
ctx.lineWidth = 2;
labels.forEach((_, row) => {
const x = chart.scales.x.getPixelForValue(values[1][row]), y = chart.scales.y.getPixelForValue(row);
ctx.beginPath();
ctx.moveTo(x, y - half);
ctx.lineTo(x, y + half);
ctx.stroke();
});
ctx.restore();
} }],
options: {
indexAxis: 'y', responsive: true, maintainAspectRatio: false, interaction: { mode: 'index', intersect: false },
plugins: {
legend: { position: 'bottom', onClick: () => { }, labels: { usePointStyle: true, generateLabels: () => [
{ text: names[0], fillStyle: '#3b82f6', strokeStyle: '#3b82f6', pointStyle: 'rect' },
{ text: names[1], fillStyle: '#0f172a', strokeStyle: '#0f172a', pointStyle: 'line', rotation: 90 },
] } },
tooltip: { filter: item => item.datasetIndex === 3, callbacks: { label: item => names.map((name, column) => `${name}: ${values[column][item.dataIndex]}`) } },
},
scales: {
x: { min: 0, max: maximum, title: { display: true, text: 'Value (Same Units)' } },
y: { grid: { display: false }, title: { display: true, text: chartData.categoryLabel } },
},
},
};
}
const chart = new Chart(document.getElementById('myChart'), createConfig(chartData));Preview and code follow the same library selection.
Run This Example
Install the package below in a browser project such as Vite. Put the copied code in a client JavaScript module and add this container to the page before the module runs.
npm install chart.js@4.5.1<div style="height:320px"><canvas id="myChart"></canvas></div>The example includes its sample data. When removing the chart, destroy or dispose of its instance and disconnect any resize observer.
Reading This Example
This illustrative weekly review shows Setup at 84 completed tasks against a target of 90, Billing at 67 against 75, and Access at 92 against 85. Access is 7 tasks above target. Setup and Access use range ends of 60, 80, and 100; Billing uses 50, 70, and 100. These are example planning thresholds, not universal performance grades.
All library tabs use these illustrative values. Rendering styles and library APIs differ, so use the table to compare exact numbers.
About this example & sample data
| Team | Actual (Tasks) | Target (Tasks) | Range 1 End | Range 2 End | Range 3 End |
|---|---|---|---|---|---|
| Setup | 84 | 90 | 60 | 80 | 100 |
| Billing | 67 | 75 | 50 | 70 | 100 |
| Access | 92 | 85 | 60 | 80 | 100 |
READ THE CHART
Read Actuals Against a Target and Context
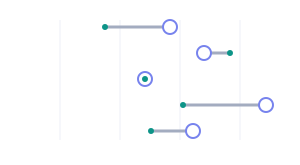
A bullet chart combines a narrow bar for an actual value, a vertical mark for a target, and shaded bands for reference ranges. It puts several pieces of context on one numeric scale without needing a separate gauge for each metric.
Separate the Bar, Mark, and Bands
The blue bar starts at zero and ends at the actual value. The dark vertical mark locates the target. Three neutral bands end at the supplied range boundaries. These boundaries are cumulative positions, not amounts to add together.
Define What the Ranges Mean
Choose thresholds that are meaningful for the metric and explain them alongside the chart. Shading alone does not establish good or bad performance. Higher completed-task counts suit this illustrative example, but higher values may be undesirable for other measures. A target is independent of the range boundaries.
Preserve Comparable Units
All rows use one zero-based scale, so actuals, targets, and boundaries must use the same units. Different metrics with unrelated units need separate charts. The scale expands to include values beyond the final range; it never clips an actual or target to make it look within plan.
Handle Boundaries Explicitly
Enter nonnegative values and ordered range ends, with a positive final end. Equal boundaries produce an empty band. Zero actuals have no bar length, while a zero target remains a mark at the origin. Blank cells and reversed boundaries preserve the last valid preview. Use the table and tooltips for exact boundaries.
KEEP EXPLORING