Comparison / Intermediate
Dumbbell Chart
Compare two values per category and see the gap between them.
Interactive Chart Preview
JAVASCRIPTEdit the column names and values to update your chart. Changes stay in this page until you reload.
| Row# | Category | Value | Value | Remove row |
|---|---|---|---|---|
| 1 | ||||
| 2 | ||||
| 3 | ||||
| 4 | ||||
| 5 |
Use distinct categories and two distinct endpoint names in the same units. Signed values, decimals, zeros, and equal endpoints are supported. Fill every cell. Rows follow table order; fewer rows are easier to read.
Chart.js Code Example
JAVASCRIPTimport Chart from 'chart.js/auto';
// Illustrative data used by the live preview.
const chartData = {
"categoryLabel": "Team",
"labels": [
"Setup",
"Billing",
"Access",
"Exports",
"Accounts"
],
"datasets": [
{
"label": "Before (Min)",
"data": [
18,
24,
16,
30,
22
],
"backgroundColor": "#3b82f6",
"borderColor": "#3b82f6"
},
{
"label": "After (Min)",
"data": [
12,
26,
16,
21,
17
],
"backgroundColor": "#0d9488",
"borderColor": "#0d9488"
}
]
};
function createConfig(chartData) {
const labels = chartData.labels;
const [first, second] = chartData.datasets;
const values = chartData.datasets.flatMap(series => series.data);
const low = Math.min(0, ...values), high = Math.max(0, ...values);
const pad = (high - low || 1) * 0.06;
return {
type: 'scatter',
data: { datasets: [
{ label: 'Gap', data: labels.flatMap((_, row) => [
{ x: Number(first.data[row]), y: row }, { x: Number(second.data[row]), y: row }, { x: NaN, y: NaN },
]), showLine: true, spanGaps: false, pointRadius: 0, pointHitRadius: 0, borderColor: '#94a3b8', borderWidth: 2, order: 3 },
...[first, second].map((series, index) => ({
label: series.label, data: labels.map((_, row) => ({ x: Number(series.data[row]), y: row })),
backgroundColor: index === 0 ? '#ffffff' : series.backgroundColor,
borderColor: series.borderColor, borderWidth: 2, pointBorderWidth: 2,
pointRadius: index === 0 ? 6 : 3, pointHoverRadius: index === 0 ? 7 : 4, order: 2 - index,
})),
] },
options: {
responsive: true, maintainAspectRatio: false,
plugins: {
legend: { position: 'bottom', onClick: () => { }, labels: { filter: item => item.datasetIndex !== 0, sort: (a, b) => a.datasetIndex - b.datasetIndex, usePointStyle: true } },
tooltip: { filter: item => item.datasetIndex !== 0, callbacks: {
title: items => items.length ? labels[items[0].dataIndex] : '',
label: item => {
const row = item.dataIndex, a = Number(first.data[row]), b = Number(second.data[row]);
return [`${first.label}: ${a}`, `${second.label}: ${b}`, `Change: ${b - a}`];
},
} },
},
scales: {
x: { min: low - pad, max: high + pad, title: { display: true, text: 'Value (Same Units)' } },
y: { min: -0.5, max: labels.length - 0.5, reverse: true, grid: { display: false },
afterBuildTicks: axis => { axis.ticks = labels.map((_, value) => ({ value })); },
ticks: { stepSize: 1, callback: value => labels[Number(value)] ?? '' }, title: { display: true, text: chartData.categoryLabel } },
},
},
};
}
const chart = new Chart(document.getElementById('myChart'), createConfig(chartData));Preview and code follow the same library selection.
Run This Example
Install the package below in a browser project such as Vite. Put the copied code in a client JavaScript module and add this container to the page before the module runs.
npm install chart.js@4.5.1<div style="height:320px"><canvas id="myChart"></canvas></div>The example includes its sample data. When removing the chart, destroy or dispose of its instance and disconnect any resize observer.
Reading This Example
This illustrative example compares median response time in minutes for five support teams. Setup falls from 18 to 12 minutes, a change of -6. Billing rises from 24 to 26, while Access stays at 16. Exports has the largest absolute gap, from 30 to 21 minutes. Lower response time is preferable in this example.
All library tabs use these illustrative values. Rendering styles and library APIs differ, so use the table to compare exact numbers.
About this example & sample data
| Team | Before (Min) | After (Min) |
|---|---|---|
| Setup | 18 | 12 |
| Billing | 24 | 26 |
| Access | 16 | 16 |
| Exports | 30 | 21 |
| Accounts | 22 | 17 |
READ THE CHART
Compare the Two Ends of Each Pair
A dumbbell chart connects two measurements for each category on a common numeric scale. The endpoints show the values, and the connector shows the size of their gap. It works well when the pair has a clear meaning, such as two periods or two groups measured in the same units.
Identify the Endpoints First
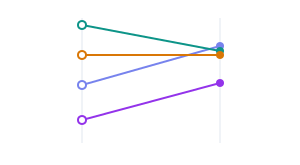
The first column uses hollow rings; the second uses smaller filled dots. Position tells you which value is larger. A filled dot inside a ring means the two values are equal. The chart keeps both endpoints visible in its legend, and tooltips report both values and second-minus-first change.
Use Comparable Measurements
Match units, population definitions, and measurement methods across the pair. A change in a team median does not show how every individual case changed. Before-and-after differences alone do not establish what caused them.
Keep the Gap in Context
Every category shares one horizontal scale, including zero in these examples. Rows follow table order. Signed values and ties are valid; a blank cell is an invalid draft, not an absent endpoint or an implicit zero. Large values can compress smaller gaps, so inspect the numbers as well as the connectors.
Choose a View for the Question
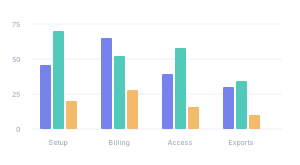
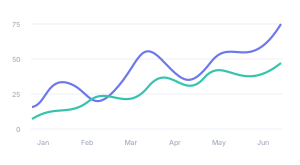
Use grouped bars when full magnitudes need more emphasis than the gap. Use a line chart when you have a longer ordered sequence. Many dumbbell rows crowd the labels, so start with a small set of categories and use the data table for exact values.
KEEP EXPLORING