Geographic / Intermediate
Bubble Map
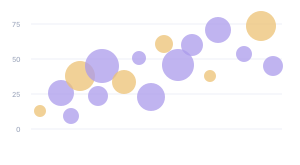
Compare values at geographic coordinates with proportional circles.
Interactive Chart Preview
JAVASCRIPTChart.js scatter circles with custom geographic placement and Canvas background paths. Circle area is proportional to value.
Edit the column names and values to update your chart. Changes stay in this page until you reload.
| Row# | Category | Category | Number | Number | Number | Remove row |
|---|---|---|---|---|---|---|
| 1 | ||||||
| 2 | ||||||
| 3 | ||||||
| 4 | ||||||
| 5 | ||||||
| 6 | ||||||
| 7 |
Use distinct IDs, latitude from -90 to 90, longitude from -180 to 180, and nonnegative values. Labels and coordinates may repeat. Zero has no circle; overlapping locations stay at their supplied coordinates.
Chart.js Code Example
JAVASCRIPTimport Chart from 'chart.js/auto';
const response = await fetch('./world.json');
if (!response.ok) throw new Error('Place world.json beside the page.');
const world = await response.json();
// Illustrative data used by the live preview.
const chartData = {
"locationHeaders": [
"Location ID",
"Label",
"Latitude",
"Longitude",
"Requests"
],
"locations": [
{
"id": "nyc",
"label": "New York",
"latitude": 40.713,
"longitude": -74.006,
"value": 120
},
{
"id": "lon",
"label": "London",
"latitude": 51.507,
"longitude": -0.128,
"value": 90
},
{
"id": "sao",
"label": "São Paulo",
"latitude": -23.551,
"longitude": -46.633,
"value": 60
},
{
"id": "nbo",
"label": "Nairobi",
"latitude": -1.292,
"longitude": 36.822,
"value": 30
},
{
"id": "bom",
"label": "Mumbai",
"latitude": 19.076,
"longitude": 72.878,
"value": 80
},
{
"id": "tyo",
"label": "Tokyo",
"latitude": 35.676,
"longitude": 139.65,
"value": 100
},
{
"id": "syd",
"label": "Sydney",
"latitude": -33.869,
"longitude": 151.209,
"value": 45
}
],
"datasets": []
};
function createConfig(chartData) {
const points = chartData.locations.filter(row => row.value > 0).sort((a, b) => b.value - a.value);
const max = Math.max(0, ...points.map(row => row.value));
const radius = (value) => max ? Math.sqrt(value / max) * 20 : 0;
const heading = chartData.locationHeaders?.[4] ?? 'Value';
const project = (longitude, latitude, width, height) => {
const scale = Math.min((width - 60) / 360, (height - 130) / 180);
return [width / 2 + longitude * scale, 35 + (height - 130) / 2 - latitude * scale];
};
const plugin = {
id: 'geographic-bubbles',
afterDatasetsUpdate(chart) {
chart.getDatasetMeta(0).data.forEach((element, index) => {
const row = points[index];
[element.x, element.y] = project(row.longitude, row.latitude, chart.width, chart.height);
});
},
beforeDatasetsDraw(chart) {
const { ctx, width, height } = chart;
ctx.save();
for (const feature of world.features) {
const path = new Path2D();
const polygons = feature.geometry.type === 'Polygon' ? [feature.geometry.coordinates] : feature.geometry.coordinates;
for (const polygon of polygons)
for (const ring of polygon) {
ring.forEach((point, i) => {
const [x, y] = project(point[0], point[1], width, height);
if (i === 0)
path.moveTo(x, y);
else
path.lineTo(x, y);
});
path.closePath();
}
ctx.fillStyle = '#e2e8f0';
ctx.fill(path, 'evenodd');
ctx.strokeStyle = '#ffffff';
ctx.lineWidth = 0.5;
ctx.stroke(path);
}
ctx.fillStyle = '#334155';
ctx.textAlign = 'center';
ctx.font = '13px sans-serif';
ctx.fillText(heading, width / 2, 20, width - 20);
ctx.font = '10px sans-serif';
if (!max)
ctx.fillText('No Positive Values', width / 2, height - 20);
else
[max / 4, max].forEach((value, i) => {
const x = width / 2 - 55 + i * 110;
ctx.beginPath();
ctx.arc(x, height - 42, radius(value), 0, Math.PI * 2);
ctx.fillStyle = 'rgba(37,99,235,0.65)';
ctx.fill();
ctx.fillStyle = '#334155';
ctx.fillText(String(value), x, height - 12, 100);
});
ctx.restore();
},
};
return {
type: 'scatter',
data: { datasets: [{ data: points.map(row => ({ x: row.longitude, y: row.latitude })), pointRadius: points.map(row => radius(row.value)), pointHoverRadius: points.map(row => radius(row.value)), pointBackgroundColor: 'rgba(37,99,235,0.65)', pointBorderWidth: 0, clip: false }] },
plugins: [plugin],
options: { responsive: true, maintainAspectRatio: false, animation: false,
scales: { x: { display: false, min: -180, max: 180 }, y: { display: false, min: -90, max: 90 } },
plugins: { legend: { display: false }, tooltip: { callbacks: { title: () => '', label: context => {
const row = points[context.dataIndex];
return `${row.label} (${row.id}): ${row.value} ${heading}; ${row.latitude}, ${row.longitude}`;
} } } },
},
};
}
const chart = new Chart(document.getElementById('myChart'), createConfig(chartData));Preview and code follow the same library selection.
Run This Example
Install the package below in a browser project such as Vite. Put the copied code in a client JavaScript module and add this container to the page before the module runs.
Download world.json. Put it beside the page (in public/ for a Vite root page). Serve the page over HTTP so the example can fetch the file.
npm install chart.js@4.5.1<div style="height:320px"><canvas id="myChart"></canvas></div>The example includes its sample data. When removing the chart, destroy or dispose of its instance and disconnect any resize observer.
Reading This Example
Seven city locations have fictional request counts from 30 to 120. New York has four times Nairobi's value, so its circle has four times the area and twice the radius. These counts are illustrative and do not describe measured traffic.
All library tabs use these illustrative values. Rendering styles and library APIs differ, so use the table to compare exact numbers.
About this example & sample data
| Location ID | Label | Latitude | Longitude | Requests |
|---|---|---|---|---|
| nyc | New York | 40.713 | -74.006 | 120 |
| lon | London | 51.507 | -0.128 | 90 |
| sao | São Paulo | -23.551 | -46.633 | 60 |
| nbo | Nairobi | -1.292 | 36.822 | 30 |
| bom | Mumbai | 19.076 | 72.878 | 80 |
| tyo | Tokyo | 35.676 | 139.65 | 100 |
| syd | Sydney | -33.869 | 151.209 | 45 |
READ THE CHART
Reading a Bubble Map
A Bubble Map places circles at geographic coordinates and makes their areas proportional to a numeric value. Use it to compare activity at sites, cities, or other supplied locations.
Supply Coordinates and Values
Each row needs a distinct ID, a display label, latitude, longitude, and a nonnegative value. Latitude is north or south of the equator; longitude is east or west of the prime meridian. Labels are not geocoded. Changing a city name does not move its circle unless you also change its coordinates.
Compare Circle Areas
A value four times larger gets four times the circle area and twice the radius. Each example scales sizes to its largest value. Editing that maximum changes every relative size, so keep a common size scale when comparing multiple maps. Zero values stay in the table and code but draw no circle. An all-zero dataset shows only the background map.
Read Overlapping Locations
Larger circles draw first so smaller ones can remain visible. Repeated coordinates are valid and are not shifted or combined. Equal circles at the same location can fully overlap; use the table to inspect every observation. Circle size represents the supplied value, not an area of geographic influence.
Choose a Map for the Question
Use a Choropleth Map for regional rates or percentages assigned to whole areas. Use a Bubble Map for values attached to locations. A Bar Chart is often clearer when you need an exact ranking and location adds little context.
Understand the World View
All examples use a longitude/latitude world view with an equirectangular projection. It distorts area and distance, especially near the poles. The background is simplified and omits some small territories. Circles near the map boundary may be clipped by native geographic renderers. No map service, API key, or live geocoding is required; download the map files from Run This Example.
KEEP EXPLORING