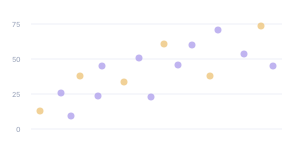
Relationship / Intermediate
Bubble Chart
Compare three numeric variables with position and bubble size.
Interactive Chart Preview
JAVASCRIPTEdit the column names and values to update your chart. Changes stay in this page until you reload.
| Row# | Label | X coordinate | Y coordinate | Radius in pixels | Remove row |
|---|---|---|---|---|---|
| 1 | |||||
| 2 | |||||
| 3 | |||||
| 4 | |||||
| 5 | |||||
| 6 | |||||
| 7 |
X and Y accept negative values and decimals. Radius must be greater than zero and up to 100 pixels; it controls radius, not area.
Chart.js Code Example
JAVASCRIPTimport Chart from 'chart.js/auto';
// Illustrative data used by the live preview.
const chartData = {
"pointLabels": {
"name": "Company",
"x": "Revenue ($B)",
"y": "Growth (%)",
"radius": "Radius (px)"
},
"datasets": [
{
"label": "Company",
"data": [
{
"x": 20,
"y": 30,
"r": 15,
"company": "Company A"
},
{
"x": 40,
"y": 10,
"r": 10,
"company": "Company B"
},
{
"x": 30,
"y": 40,
"r": 20,
"company": "Company C"
},
{
"x": 60,
"y": 35,
"r": 12,
"company": "Company D"
},
{
"x": 50,
"y": 25,
"r": 18,
"company": "Company E"
},
{
"x": 35,
"y": 15,
"r": 8,
"company": "Company F"
},
{
"x": 25,
"y": 50,
"r": 22,
"company": "Company G"
}
],
"backgroundColor": [
"rgba(255, 99, 132, 0.6)",
"rgba(54, 162, 235, 0.6)",
"rgba(255, 205, 86, 0.6)",
"rgba(75, 192, 192, 0.6)",
"rgba(153, 102, 255, 0.6)",
"rgba(255, 159, 64, 0.6)",
"rgba(199, 199, 199, 0.6)"
],
"borderColor": [
"rgba(255, 99, 132, 1)",
"rgba(54, 162, 235, 1)",
"rgba(255, 205, 86, 1)",
"rgba(75, 192, 192, 1)",
"rgba(153, 102, 255, 1)",
"rgba(255, 159, 64, 1)",
"rgba(199, 199, 199, 1)"
],
"borderWidth": 2
}
]
};
function createConfig(chartData) {
let chartType = 'bar';
let options = {
responsive: true,
maintainAspectRatio: false,
plugins: {
legend: {
position: 'bottom',
},
tooltip: {
mode: 'nearest',
intersect: false,
},
},
};
chartType = 'bubble';
const labels = chartData.pointLabels;
options.scales = {
x: {
type: 'linear',
position: 'bottom',
title: { display: true, text: labels.x },
},
y: {
type: 'linear',
title: { display: true, text: labels.y },
},
};
options.plugins.legend.display = false;
options.plugins.tooltip = {
callbacks: {
label: function (context) {
const point = context.raw;
return [
`${labels.name}: ${point.company}`,
`${labels.x}: ${point.x}`,
`${labels.y}: ${point.y}`,
`${labels.radius}: ${point.r}`,
];
},
},
};
return { type: chartType, data: structuredClone(chartData), options };
}
const chart = new Chart(document.getElementById('myChart'), createConfig(chartData));Preview and code follow the same library selection.
Run This Example
Install the package below in a browser project such as Vite. Put the copied code in a client JavaScript module and add this container to the page before the module runs.
npm install chart.js@4.5.1<div style="height:320px"><canvas id="myChart"></canvas></div>The example includes its sample data. When removing the chart, destroy or dispose of its instance and disconnect any resize observer.
Reading This Example
The default Chart.js example uses seven fictional companies. Company D has the largest x value, 60, while Company G has the largest y value, 50, and radius, 22 pixels. The axes illustrate revenue in billions and growth in percent; these are synthetic values, not real company measurements.
All library tabs use these illustrative values. Rendering styles and library APIs differ, so use the table to compare exact numbers.
About this example & sample data
| Company | Revenue ($B) | Growth (%) | Radius (px) |
|---|---|---|---|
| Company A | 20 | 30 | 15 |
| Company B | 40 | 10 | 10 |
| Company C | 30 | 40 | 20 |
| Company D | 60 | 35 | 12 |
| Company E | 50 | 25 | 18 |
| Company F | 35 | 15 | 8 |
| Company G | 25 | 50 | 22 |
READ THE CHART
Compare Two Values and a Size
A bubble chart extends a scatter plot with differently sized markers. Position encodes two numeric variables, and size adds a third. Each bubble still represents one observation, so every encoding needs a clear label.
Name All Three Measures
State what the horizontal position, vertical position, and bubble size mean. Use a label or tooltip to identify each observation. Avoid adding more encodings unless they help answer the question.
Scale Area Carefully
If size represents a quantity, make area proportional to that quantity. Radius must then grow with its square root. The Chart.js example supplies r directly in pixels, so doubling r makes the bubble area four times larger.
Manage Overlap
Use transparency and restrained sizes so large bubbles do not hide smaller ones. A size legend helps readers interpret area. For crowded data, separate groups or use a simpler scatter plot.
Read Position Before Size
Find high and low x and y values before comparing bubbles. Size alone does not indicate better performance, and association does not establish causation. A scatter plot is enough when the third measure is not useful.
KEEP EXPLORING