Geographic / Intermediate
Choropleth Map
Compare regional rates or values with shaded geographic areas.
Interactive Chart Preview
JAVASCRIPTCustom Canvas geographic paths in a Chart.js plugin. Hover a region for its value; gray regions have no data.
Edit the column names and values to update your chart. Changes stay in this page until you reload.
| Row# | Category | Number | Remove row |
|---|---|---|---|
| 1 | |||
| 2 | |||
| 3 | |||
| 4 | |||
| 5 | |||
| 6 | |||
| 7 | |||
| 8 |
Choose each map region once. Use nonnegative values with consistent units. Gray regions have no row; zero is a real value. This overview map includes 177 regions and omits some small territories.
Chart.js Code Example
JAVASCRIPTimport Chart from 'chart.js/auto';
const response = await fetch('./world.json');
if (!response.ok) throw new Error('Place world.json beside the page.');
const world = await response.json();
// Illustrative data used by the live preview.
const chartData = {
"regionHeaders": [
"Map Region",
"Coverage (%)"
],
"regions": [
{
"code": "USA",
"value": 72
},
{
"code": "CAN",
"value": 84
},
{
"code": "BRA",
"value": 56
},
{
"code": "GBR",
"value": 91
},
{
"code": "FRA",
"value": 78
},
{
"code": "IND",
"value": 48
},
{
"code": "JPN",
"value": 86
},
{
"code": "AUS",
"value": 65
}
],
"datasets": []
};
function createConfig(chartData) {
const values = new Map(chartData.regions.map(row => [row.code, row.value]));
const max = Math.max(...chartData.regions.map(row => row.value)) || 1;
const heading = chartData.regionHeaders?.[1] ?? 'Value';
const color = (value) => `rgb(${[219, 234, 254].map((channel, i) => Math.round(channel + ([30, 64, 175][i] - channel) * value / max)).join(',')})`;
let paths = [];
const plugin = {
id: 'geographic-regions',
beforeDatasetsDraw(chart) {
const { ctx, width, height } = chart;
const scale = Math.min((width - 20) / 360, (height - 90) / 180);
const x = (longitude) => width / 2 + longitude * scale;
const y = (latitude) => 35 + (height - 90) / 2 - latitude * scale;
ctx.save();
paths = world.features.map(feature => {
const path = new Path2D();
const polygons = feature.geometry.type === 'Polygon' ? [feature.geometry.coordinates] : feature.geometry.coordinates;
for (const polygon of polygons)
for (const ring of polygon) {
ring.forEach((point, i) => i === 0 ? path.moveTo(x(point[0]), y(point[1])) : path.lineTo(x(point[0]), y(point[1])));
path.closePath();
}
const value = values.get(feature.id);
ctx.fillStyle = value === undefined ? '#e2e8f0' : color(value);
ctx.fill(path, 'evenodd');
ctx.strokeStyle = '#ffffff';
ctx.lineWidth = 0.5;
ctx.stroke(path);
return path;
});
ctx.fillStyle = '#334155';
ctx.font = '13px sans-serif';
ctx.textAlign = 'center';
ctx.fillText(heading, width / 2, 20, width - 20);
const left = width / 2 - 105, top = height - 39;
const gradient = ctx.createLinearGradient(left, top, left + 120, top);
gradient.addColorStop(0, color(0));
gradient.addColorStop(1, color(max));
ctx.fillStyle = gradient;
ctx.fillRect(left, top, 120, 9);
ctx.fillStyle = '#e2e8f0';
ctx.fillRect(left + 138, top, 12, 9);
ctx.fillStyle = '#334155';
ctx.font = '10px sans-serif';
ctx.textAlign = 'left';
ctx.fillText('0', left, top + 23);
ctx.fillText(String(max), left + 100, top + 23, 60);
ctx.fillText('No Data', left + 154, top + 9);
ctx.restore();
},
afterEvent(chart, args) {
const { x, y, type } = args.event;
const index = type === 'mouseout' || x === null || y === null ? -1 : paths.findIndex(path => chart.ctx.isPointInPath(path, x * chart.currentDevicePixelRatio, y * chart.currentDevicePixelRatio, 'evenodd'));
if (index >= 0) {
const point = chart.getDatasetMeta(0).data[index];
point.x = x;
point.y = y;
}
chart.tooltip?.setActiveElements(index < 0 ? [] : [{ datasetIndex: 0, index }], { x: x ?? 0, y: y ?? 0 });
args.changed = true;
},
};
return {
type: 'scatter',
data: { datasets: [{ data: world.features.map(() => ({ x: 0, y: 0 })), pointRadius: 0, pointHoverRadius: 0 }] },
plugins: [plugin],
options: { responsive: true, maintainAspectRatio: false, animation: false, events: ['mousemove', 'mouseout', 'click', 'touchstart', 'touchmove'],
scales: { x: { display: false }, y: { display: false } },
plugins: { legend: { display: false }, tooltip: { displayColors: false, callbacks: { title: () => '', label: context => {
const feature = world.features[context.dataIndex];
return `${feature.properties.label} (${feature.id}): ${values.has(feature.id) ? `${values.get(feature.id)} ${heading}` : 'No Data'}`;
} } } },
},
};
}
const chart = new Chart(document.getElementById('myChart'), createConfig(chartData));Preview and code follow the same library selection.
Run This Example
Install the package below in a browser project such as Vite. Put the copied code in a client JavaScript module and add this container to the page before the module runs.
Download world.json. Put it beside the page (in public/ for a Vite root page). Serve the page over HTTP so the example can fetch the file.
npm install chart.js@4.5.1<div style="height:320px"><canvas id="myChart"></canvas></div>The example includes its sample data. When removing the chart, destroy or dispose of its instance and disconnect any resize observer.
Reading This Example
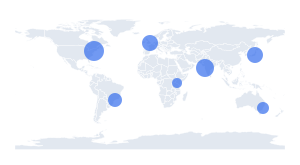
Eight regions have fictional coverage percentages from 48% to 91%. These are illustrative values, not measured country statistics. The remaining regions are gray because no value was supplied.
All library tabs use these illustrative values. Rendering styles and library APIs differ, so use the table to compare exact numbers.
About this example & sample data
| Map Region | Coverage (%) |
|---|---|
| United States of America (USA) | 72 |
| Canada (CAN) | 84 |
| Brazil (BRA) | 56 |
| United Kingdom (GBR) | 91 |
| France (FRA) | 78 |
| India (IND) | 48 |
| Japan (JPN) | 86 |
| Australia (AUS) | 65 |
READ THE CHART
Reading a Choropleth Map
A Choropleth Map fills geographic regions according to a shared numeric scale. Use it when location is part of the question and you want to compare regional patterns.
Choose Comparable Values
Rates, percentages, and per-person measures often make fairer regional comparisons than raw totals. Large populations tend to produce large counts. Supply the rate yourself; this example does not calculate a denominator or constrain values to percentages.
Match the Map Regions
Each dropdown name has a code from this map. Codes identify the bundled regions and do not always match ISO country codes. Choose a region once. Removing its row marks it as missing; setting its value to zero keeps it in the color scale.
Read the Color Scale
Light blue is zero and dark blue is the largest supplied value. Gray means no data. Editing the maximum changes the color scale, so use fixed limits in your own implementation when comparing separate maps. All-zero data uses a zero-to-one legend, with every supplied region at zero.
Account for Geographic Distortion
This longitude/latitude world view uses an equirectangular projection. It distorts area and distance, especially near the poles. Large regions attract more attention even when their values are small. Boundaries are simplified for a world overview, and some small territories are absent. Use the table for exact values and a Bar Chart for precise rankings.
Run the Examples
Download world.json from Run This Example and keep its region identifiers intact. Each library uses the same boundaries and illustrative values. Chart.js draws custom Canvas paths; Seaborn styles Matplotlib map patches. The other live tabs use geographic drawing APIs. No map service or API key is needed.
KEEP EXPLORING