Trend / Intermediate
Stacked Area Chart
Track a changing total and the contributions that make it up.
Interactive Chart Preview
JAVASCRIPTEdit the column names and values to update your chart. Changes stay in this page until you reload.
| Row# | Ordered Label | Value | Value | Value | Remove row |
|---|---|---|---|---|---|
| 1 | |||||
| 2 | |||||
| 3 | |||||
| 4 | |||||
| 5 | |||||
| 6 |
Rows are equally spaced in table order. Use nonnegative contributions in the same units and a value in every cell. Blank cells are not zeros or gaps. Columns stack from bottom to top. Up to 20 series.
Chart.js Code Example
JAVASCRIPTimport Chart from 'chart.js/auto';
// Illustrative data used by the live preview.
const chartData = {
"categoryLabel": "Week",
"labels": [
"W1",
"W2",
"W3",
"W4",
"W5",
"W6"
],
"datasets": [
{
"label": "Email",
"data": [
38,
42,
36,
48,
52,
46
],
"backgroundColor": "#3b82f6",
"borderColor": "#3b82f6"
},
{
"label": "Chat",
"data": [
24,
28,
31,
29,
34,
38
],
"backgroundColor": "#0d9488",
"borderColor": "#0d9488"
},
{
"label": "Phone",
"data": [
12,
10,
14,
11,
13,
12
],
"backgroundColor": "#d97706",
"borderColor": "#d97706"
}
]
};
function createConfig(chartData) {
return {
type: 'line',
data: { labels: chartData.labels, datasets: chartData.datasets.map((series, index) => ({
label: series.label, data: [...series.data], backgroundColor: series.backgroundColor,
borderColor: series.borderColor, borderWidth: 1, pointRadius: 3, tension: 0, stack: 'total',
fill: index === 0 ? 'origin' : '-1',
})) },
options: {
responsive: true, maintainAspectRatio: false,
interaction: { mode: 'index', intersect: false },
plugins: { legend: { position: 'bottom', onClick: () => { } }, tooltip: { callbacks: {
footer: items => items.length ? `Total: ${chartData.datasets.reduce((sum, series) => sum + Number(series.data[items[0].dataIndex]), 0)}` : '',
} } },
scales: {
x: { title: { display: true, text: chartData.categoryLabel }, grid: { display: false } },
y: { stacked: true, beginAtZero: true, title: { display: true, text: 'Value' } },
},
},
};
}
const chart = new Chart(document.getElementById('myChart'), createConfig(chartData));Preview and code follow the same library selection.
Run This Example
Install the package below in a browser project such as Vite. Put the copied code in a client JavaScript module and add this container to the page before the module runs.
npm install chart.js@4.5.1<div style="height:320px"><canvas id="myChart"></canvas></div>The example includes its sample data. When removing the chart, destroy or dispose of its instance and disconnect any resize observer.
Reading This Example
This illustrative six-week workload totals 74, 80, 81, 88, 99, and 96 across Email, Chat, and Phone. Email is the bottom layer and contributes 52 of the 99 units in W5. The upper boundary reaches its largest observed value in W5, then falls to 96 in W6.
All library tabs use these illustrative values. Rendering styles and library APIs differ, so use the table to compare exact numbers.
About this example & sample data
| Week | Chat | Phone | |
|---|---|---|---|
| W1 | 38 | 24 | 12 |
| W2 | 42 | 28 | 10 |
| W3 | 36 | 31 | 14 |
| W4 | 48 | 29 | 11 |
| W5 | 52 | 34 | 13 |
| W6 | 46 | 38 | 12 |
READ THE CHART
Follow the Whole and Its Contributions
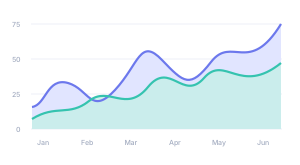
A stacked area chart places each series above the previous one. The upper edge shows the combined total, while the thickness of a layer shows its contribution. It suits nonnegative parts measured in the same units over a meaningful sequence.
Read Thickness Within Each Layer
Only the bottom layer has a fixed zero baseline. For the other layers, measure the distance between their upper and lower boundaries. A rising upper edge alone does not prove that a contribution grew. Tooltips report the raw contribution and the total at that row.
Keep Order and Units Consistent
Rows are equally spaced in table order, and columns stack from bottom to top. Use evenly spaced observations and the same units in every series. Date-like labels are not parsed into elapsed time. Keep the column order stable when comparing versions of a chart.
Distinguish Zero From Missing Data
Each cell must contain a nonnegative value. An explicit zero makes a layer disappear at that row; a blank cell is an invalid draft and preserves the previous preview. Straight boundaries connect observations without smoothing. A single row shows boundary markers because one observation cannot enclose an area.
Choose the Comparison That Matters
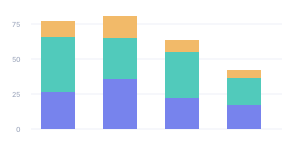
A line chart gives each series a shared baseline and makes individual trends easier to compare. Stacked bars suit discrete periods when the connecting area adds little. This chart keeps all legend layers visible so the total stays consistent; remove a series in the table to change which contributions are included.
KEEP EXPLORING