Trend / Beginner
Area Chart
Emphasize magnitude of change over time.
Interactive Chart Preview
JAVASCRIPTEdit the column names and values to update your chart. Changes stay in this page until you reload.
| Row# | Category | Number | Remove row |
|---|---|---|---|
| 1 | |||
| 2 | |||
| 3 | |||
| 4 | |||
| 5 | |||
| 6 |
Rows follow the order shown. Negative values and decimals are supported.
Chart.js Code Example
JAVASCRIPTimport Chart from 'chart.js/auto';
// Illustrative data used by the live preview.
const chartData = {
"categoryLabel": "Month",
"labels": [
"Jan",
"Feb",
"Mar",
"Apr",
"May",
"Jun"
],
"datasets": [
{
"label": "Revenue",
"data": [
15000,
18500,
22000,
19500,
25000,
28000
],
"backgroundColor": "rgba(139, 92, 246, 0.2)",
"borderColor": "#8b5cf6",
"borderWidth": 2,
"fill": true
}
]
};
function createConfig(chartData) {
let chartType = 'bar';
let options = {
responsive: true,
maintainAspectRatio: false,
plugins: {
legend: {
position: 'bottom',
},
tooltip: {
mode: 'index',
intersect: false,
},
},
};
chartType = 'line';
options.scales = {
y: {
beginAtZero: true,
title: { display: true, text: chartData.datasets[0].label },
grid: { color: 'rgba(0, 0, 0, 0.1)' },
},
x: {
title: { display: true, text: chartData.categoryLabel },
grid: { display: false },
},
};
options.plugins.filler = { propagate: false };
return { type: chartType, data: structuredClone(chartData), options };
}
const chart = new Chart(document.getElementById('myChart'), createConfig(chartData));Preview and code follow the same library selection.
Run This Example
Install the package below in a browser project such as Vite. Put the copied code in a client JavaScript module and add this container to the page before the module runs.
npm install chart.js@4.5.1<div style="height:320px"><canvas id="myChart"></canvas></div>The example includes its sample data. When removing the chart, destroy or dispose of its instance and disconnect any resize observer.
Reading This Example
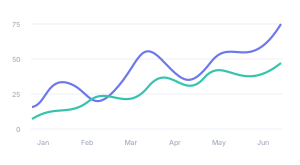
The default Chart.js example shows illustrative monthly Revenue values of 15,000, 18,500, 22,000, 19,500, 25,000, and 28,000. April falls below March before the series rises again. These are period values, not a running cumulative total.
All library tabs use these illustrative values. Rendering styles and library APIs differ, so use the table to compare exact numbers.
About this example & sample data
| Month | Revenue |
|---|---|
| Jan | 15000 |
| Feb | 18500 |
| Mar | 22000 |
| Apr | 19500 |
| May | 25000 |
| Jun | 28000 |
READ THE CHART
Show Magnitude Alongside a Trend
An area chart fills the space between a line and a baseline. It emphasizes the amount represented by a series over an ordered interval. The filled region makes the baseline and the treatment of multiple series especially important.
Use an Ordered Series
Start with a date or another ordered variable and a numeric measure at each position. Keep intervals and units consistent. Use a bar chart for separate categories without a meaningful sequence.
Keep the Baseline Honest
A zero baseline lets the filled height represent the full value. A truncated baseline exaggerates the amount of filled area. Label the units and make missing periods clear.
Do Not Assume Accumulation
Filling below a line does not turn period values into cumulative totals. A cumulative series must be calculated explicitly. For stacked areas, each band is a contribution and the top boundary is the sum.
Watch Overlapping Fills
Overlapping areas can hide a smaller series. Use lines when comparing several trends, or a stacked area when the total and its parts matter. Comparing the middle bands of a stack is harder because they lack a common baseline.
KEEP EXPLORING