Comparison / Intermediate
Slope Chart
Compare the direction and size of change between two observations.
Interactive Chart Preview
JAVASCRIPTEdit the column names and values to update your chart. Changes stay in this page until you reload.
| Row# | Category | Value | Value | Remove row |
|---|---|---|---|---|
| 1 | ||||
| 2 | ||||
| 3 | ||||
| 4 |
Use distinct categories and two named observations in the same units. Signed values, decimals, zeros, and ties are valid. Fill every cell. Crowded labels are omitted, while coincident lines overlap; use the table for exact values.
Chart.js Code Example
JAVASCRIPTimport Chart from 'chart.js/auto';
// Illustrative data used by the live preview.
const chartData = {
"categoryLabel": "Service",
"labels": [
"Setup",
"Billing",
"Access",
"Exports"
],
"datasets": [
{
"label": "Round 1",
"data": [
42,
78,
60,
28
],
"backgroundColor": "#3b82f6",
"borderColor": "#3b82f6"
},
{
"label": "Round 2",
"data": [
65,
62,
60,
45
],
"backgroundColor": "#0d9488",
"borderColor": "#0d9488"
}
]
};
function createConfig(chartData) {
const labels = chartData.labels;
const periods = chartData.datasets.map(series => series.label);
const rows = labels.map((label, row) => ({ label, values: chartData.datasets.map(series => Number(series.data[row])) }));
const values = rows.flatMap(row => row.values);
const low = Math.min(0, ...values), high = Math.max(0, ...values), pad = (high - low || 1) * 0.06;
const domain = [low - pad, high + pad];
const colors = ['#3b82f6', '#0d9488', '#d97706', '#9333ea', '#e11d48', '#475569'];
const shorten = (value, max = 10) => value.length > max ? `${value.slice(0, max - 1)}…` : value;
const compact = (value) => Math.abs(value) >= 1e4 ? value.toExponential(2) : String(Number(value.toPrecision(4)));
const labelText = (row, side) => `${shorten(labels[row])} ${compact(rows[row].values[side])}`;
const visible = [0, 1].map(side => {
const selected = new Set();
let last = Infinity;
rows.map((row, index) => ({ value: row.values[side], index })).sort((a, b) => b.value - a.value || a.index - b.index).forEach(item => {
if (last - item.value >= (domain[1] - domain[0]) * 0.075) {
selected.add(item.index);
last = item.value;
}
});
return selected;
});
return {
type: 'line',
data: { labels: periods, datasets: rows.map((row, index) => ({
label: row.label, data: row.values, borderColor: colors[index % colors.length],
backgroundColor: colors[index % colors.length], pointBackgroundColor: ['#ffffff', colors[index % colors.length]],
pointBorderWidth: 2, pointRadius: 4, borderWidth: 2, tension: 0, fill: false,
})) },
plugins: [{ id: 'endpoint-labels', afterDatasetsDraw: chart => {
const ctx = chart.ctx;
ctx.save();
ctx.font = '11px sans-serif';
ctx.textBaseline = 'middle';
rows.forEach((_, row) => chart.getDatasetMeta(row).data.forEach((point, side) => {
if (!visible[side].has(row))
return;
ctx.fillStyle = colors[row % colors.length];
ctx.textAlign = side === 0 ? 'right' : 'left';
ctx.fillText(labelText(row, side), point.x + (side === 0 ? -9 : 9), point.y, 87);
}));
ctx.restore();
} }],
options: {
responsive: true, maintainAspectRatio: false, layout: { padding: { left: 98, right: 98, bottom: 15 } },
plugins: { legend: { display: false }, tooltip: { callbacks: {
label: item => `${item.dataset.label}: ${item.parsed.y}`,
afterLabel: item => `Change: ${rows[item.datasetIndex].values[1] - rows[item.datasetIndex].values[0]}`,
} } },
scales: {
x: { position: 'top', border: { display: false }, grid: { color: '#e2e8f0', drawTicks: false }, ticks: { callback: value => shorten(periods[Number(value)], 16), maxRotation: 0 } },
y: { display: false, min: domain[0], max: domain[1] },
},
},
};
}
const chart = new Chart(document.getElementById('myChart'), createConfig(chartData));Preview and code follow the same library selection.
Run This Example
Install the package below in a browser project such as Vite. Put the copied code in a client JavaScript module and add this container to the page before the module runs.
npm install chart.js@4.5.1<div style="height:320px"><canvas id="myChart"></canvas></div>The example includes its sample data. When removing the chart, destroy or dispose of its instance and disconnect any resize observer.
Reading This Example
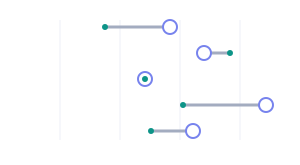
These illustrative service scores compare two survey rounds. Setup rises from 42 to 65, the largest increase at 23 points. Billing falls from 78 to 62, while Access stays at 60 and Exports rises from 28 to 45. Setup finishes above Billing after starting below it. Nearby right-side labels may be omitted; all four pairs remain in the chart and table.
All library tabs use these illustrative values. Rendering styles and library APIs differ, so use the table to compare exact numbers.
About this example & sample data
| Service | Round 1 | Round 2 |
|---|---|---|
| Setup | 42 | 65 |
| Billing | 78 | 62 |
| Access | 60 | 60 |
| Exports | 28 | 45 |
READ THE CHART
Follow Change From One Observation to the Next
A slope chart places two observations on matching vertical scales and connects each category across them. An upward segment means an increase; a downward segment means a decrease. A horizontal segment means no change. Read the endpoint values to judge the size of the difference.
Keep Both Sides on One Scale
Both columns use the same units and vertical domain, including zero in these examples. Higher positions mean larger values. The left and right headings identify the observations. Hollow markers identify the first observation and filled markers identify the second.
Read Crossings as Changes in Order
Crossing segments show that categories switched relative order between the two observations. They do not show when that happened, or what happened in between. The horizontal separation is a layout choice, so the angle is not a rate per unit of time.
Expect Overlap Near Ties
Endpoint positions are never shifted to make room for text. Close labels are omitted independently on each side, but every segment and point remains. Completely identical pairs overlap. Labels abbreviate long names and round values for space; tooltips and the table retain exact values. A dumbbell chart separates categories into rows when overlap becomes difficult to read.
Compare Like With Like
Use matching definitions and units across observations. Signed values and ties are supported. A blank value keeps the last valid preview rather than drawing a partial pair. Use a line chart for more than two ordered observations, and do not infer a cause from a change alone.
KEEP EXPLORING