Composition / Advanced
Sunburst Chart
Follow a hierarchy outward from its root and compare branch shares.
Interactive Chart Preview
JAVASCRIPTA custom Chart.js plugin draws radial partitions with native tooltips.
Edit the column names and values to update your chart. Changes stay in this page until you reload.
| Row# | Unique Node ID | Display Label | Blank for Root | Leaf Value / Calculated Total | Remove row |
|---|---|---|---|---|---|
| 1 | |||||
| 2 | |||||
| 3 | |||||
| 4 | |||||
| 5 | |||||
| 6 | |||||
| 7 |
Use unique IDs and one root with a blank Parent ID. Enter values only for leaves; parent totals are calculated. Parent IDs must exist and must not create a cycle. At least one leaf must be positive.
Chart.js Code Example
JAVASCRIPTimport Chart from 'chart.js/auto';
// Illustrative data used by the live preview.
const chartData = {
"hierarchyHeaders": [
"ID",
"Label",
"Parent ID",
"GB"
],
"nodes": [
{
"id": "workspace",
"label": "Workspace",
"parentId": "",
"value": 0
},
{
"id": "docs",
"label": "Documents",
"parentId": "workspace",
"value": 0
},
{
"id": "assets",
"label": "Assets",
"parentId": "workspace",
"value": 0
},
{
"id": "guides",
"label": "Guides",
"parentId": "docs",
"value": 42
},
{
"id": "notes",
"label": "Notes",
"parentId": "docs",
"value": 28
},
{
"id": "images",
"label": "Images",
"parentId": "assets",
"value": 18
},
{
"id": "video",
"label": "Video",
"parentId": "assets",
"value": 12
}
],
"datasets": []
};
function createConfig(chartData) {
const nodes = chartData.nodes;
const children = (id) => nodes.filter(node => node.parentId === id);
const totals = new Map();
const total = (id) => {
if (totals.has(id))
return totals.get(id);
const items = children(id);
const value = items.length ? items.reduce((sum, child) => sum + total(child.id), 0) : nodes.find(node => node.id === id).value;
totals.set(id, value);
return value;
};
const root = nodes.find(node => !node.parentId);
const palette = ['#2563eb', '#0f766e', '#b45309', '#7c3aed', '#be185d'];
const path = (id) => {
const node = nodes.find(node => node.id === id);
return node.parentId ? [...path(node.parentId), node.label] : [node.label];
};
const depth = Math.max(...nodes.map(node => path(node.id).length));
const sectors = [];
function divide(id, start, end, level, color) {
if (total(id) <= 0)
return;
sectors.push({ id, start, end, inner: level / depth, outer: (level + 1) / depth, color });
let angle = start;
children(id).forEach((child, index) => {
const next = angle + (end - start) * total(child.id) / total(id);
divide(child.id, angle, next, level + 1, level === 0 ? palette[index % palette.length] : color);
angle = next;
});
}
divide(root.id, 0, Math.PI * 2, 0, '#334155');
const geometry = (chart) => ({ x: (chart.chartArea.left + chart.chartArea.right) / 2,
y: (chart.chartArea.top + chart.chartArea.bottom) / 2,
radius: Math.min(chart.chartArea.width, chart.chartArea.height) / 2 - 6 });
return {
type: 'scatter',
data: { datasets: [{ data: sectors.map(sector => {
const angle = (sector.start + sector.end) / 2 - Math.PI / 2;
const radius = sector.inner === 0 ? 0 : (sector.inner + sector.outer) / 2;
return { x: Math.cos(angle) * radius, y: Math.sin(angle) * radius };
}), pointRadius: 0, pointHoverRadius: 0, pointHitRadius: 0 }] },
options: {
responsive: true, maintainAspectRatio: false, animation: false,
scales: { x: { min: -1, max: 1, display: false }, y: { min: -1, max: 1, reverse: true, display: false } },
plugins: { legend: { display: false }, tooltip: { callbacks: {
title: items => path(sectors[items[0].dataIndex].id),
label: item => `${chartData.hierarchyHeaders[3]}: ${total(sectors[item.dataIndex].id)} (${(total(sectors[item.dataIndex].id) / total(root.id) * 100).toFixed(1)}% of total)`,
} } },
},
// A custom radial partition, with native Chart.js tooltip hit testing.
plugins: [{ id: 'hierarchy-sectors', afterDatasetsDraw(chart) {
const { ctx } = chart, { x, y, radius } = geometry(chart);
ctx.save();
sectors.forEach(sector => {
const start = sector.start - Math.PI / 2, end = sector.end - Math.PI / 2;
const inner = sector.inner * radius, outer = sector.outer * radius;
ctx.beginPath();
ctx.arc(x, y, outer, start, end);
if (inner > 0)
ctx.arc(x, y, inner, end, start, true);
else if (end - start < Math.PI * 2)
ctx.lineTo(x, y);
ctx.closePath();
ctx.fillStyle = sector.color;
ctx.fill();
ctx.strokeStyle = '#fff';
ctx.lineWidth = Math.min(1, (outer - inner) * 0.2);
ctx.stroke();
const middle = (start + end) / 2, labelRadius = inner === 0 ? 0 : (inner + outer) / 2;
if (outer - inner < 28 || (inner > 0 && (end - start) * labelRadius < 28))
return;
const available = inner === 0 ? outer * 1.6 : outer - inner - 8;
const limit = Math.floor(available / 6);
const raw = nodes.find(node => node.id === sector.id).label;
const label = raw.length > limit ? raw.slice(0, Math.max(0, limit - 1)) + '…' : raw;
ctx.save();
ctx.clip();
ctx.translate(x + Math.cos(middle) * labelRadius, y + Math.sin(middle) * labelRadius);
if (inner > 0)
ctx.rotate(middle + (Math.cos(middle) < 0 ? Math.PI : 0));
ctx.fillStyle = '#fff';
ctx.font = '11px sans-serif';
ctx.textAlign = 'center';
ctx.textBaseline = 'middle';
ctx.fillText(label, 0, -6);
ctx.fillText(String(total(sector.id)), 0, 8, available);
ctx.restore();
});
ctx.restore();
}, afterEvent(chart, args) {
const { x, y, type } = args.event, center = geometry(chart);
const distance = x === null || y === null ? -1 : Math.hypot(x - center.x, y - center.y) / center.radius;
const angle = x === null || y === null ? 0 : (Math.atan2(y - center.y, x - center.x) + Math.PI / 2 + Math.PI * 2) % (Math.PI * 2);
const index = type === 'mouseout' ? -1 : sectors.findIndex(sector => distance >= sector.inner && distance <= sector.outer && angle >= sector.start && angle <= sector.end);
const active = index < 0 ? [] : [{ datasetIndex: 0, index }];
chart.setActiveElements(active);
chart.tooltip?.setActiveElements(active, { x: x ?? 0, y: y ?? 0 });
args.changed = true;
} }],
};
}
const chart = new Chart(document.getElementById('myChart'), createConfig(chartData));Preview and code follow the same library selection.
Run This Example
Install the package below in a browser project such as Vite. Put the copied code in a client JavaScript module and add this container to the page before the module runs.
npm install chart.js@4.5.1<div style="height:320px"><canvas id="myChart"></canvas></div>The example includes its sample data. When removing the chart, destroy or dispose of its instance and disconnect any resize observer.
Reading This Example
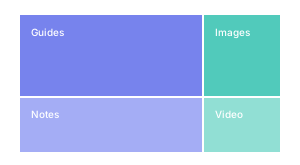
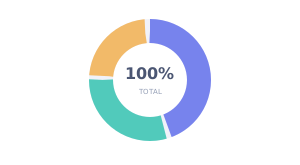
This illustrative workspace contains 100 GB, matching the Treemap example. Documents uses 70 GB, so its branch spans 70% of the circle. Guides uses 42 GB, which is 42% of the workspace and 60% of Documents. Notes uses 28 GB. Assets uses the remaining 30 GB, split between Images at 18 and Video at 12.
All library tabs use these illustrative values. Rendering styles and library APIs differ, so use the table to compare exact numbers.
About this example & sample data
| ID | Label | Parent ID | GB |
|---|---|---|---|
| workspace | Workspace | (Root) | 100 |
| docs | Documents | workspace | 70 |
| assets | Assets | workspace | 30 |
| guides | Guides | docs | 42 |
| notes | Notes | docs | 28 |
| images | Images | assets | 18 |
| video | Video | assets | 12 |
READ THE CHART
Follow Branches From the Center Outward
A sunburst chart puts the root of a hierarchy in the center and its descendants in successive rings. A child occupies an angular part of its parent branch. It helps you follow category membership while seeing which branches contribute most to the whole.
Enter Values at the Leaves
Use unique IDs to connect each row to its parent. One root has a blank Parent ID. Enter amounts only for leaves; parent totals are calculated from their descendants. Display labels can repeat because IDs define identity. Parent references must exist and cannot form cycles.
Compare Angles Within the Hierarchy
Each parent span is divided among its children in proportion to their values. Compare angles within a ring or follow a branch outward. Do not compare sector areas across rings: outer rings have a larger circumference. Color identifies the top-level branch and does not encode another quantity.
Keep the Denominator Clear
Tooltips report each path, value, and share of the original root total. A parent already includes its children, so adding every visible sector double counts the data. Zero-value leaves remain in the table and copied data but have no angular span. At least one leaf must be positive.
Allow Space for Labels
Small sectors and deep trees can be difficult to read. Examples omit labels that do not fit; use the table and tooltips for full values. Native layouts can differ in rotation, ring sizing, and label placement. Plotly lets you click into a branch and click the center to return; tooltip shares still use the original total. Use Treemap for a rectangular hierarchy or Bar Chart for precise value comparisons.
KEEP EXPLORING