Relationship / Advanced
Chord Diagram
Compare weighted connections between groups around a circle.
Interactive Chart Preview
JAVASCRIPTEdit the column names and values to update your chart. Changes stay in this page until you reload.
| Row# | First Group Name | Second Group Name | Nonnegative Pair Value | Remove row |
|---|---|---|---|---|
| 1 | ||||
| 2 | ||||
| 3 | ||||
| 4 | ||||
| 5 | ||||
| 6 |
Names identify groups exactly, including case. Enter each undirected pair once, in either order. Use different groups, nonnegative values, and at least one positive pair. Cycles are valid. Zero pairs have no visible ribbon.
Chart.js Code Example
JAVASCRIPTimport Chart from 'chart.js/auto';
// Illustrative data used by the live preview.
const chartData = {
"connectionHeaders": [
"First Group",
"Second Group",
"Collaborations"
],
"connections": [
{
"first": "Design",
"second": "Engineering",
"value": 12
},
{
"first": "Design",
"second": "Support",
"value": 5
},
{
"first": "Design",
"second": "Research",
"value": 8
},
{
"first": "Engineering",
"second": "Support",
"value": 10
},
{
"first": "Engineering",
"second": "Research",
"value": 6
},
{
"first": "Support",
"second": "Research",
"value": 3
}
],
"datasets": []
};
function createConfig(chartData) {
const pairs = chartData.connections.filter(pair => pair.value > 0);
const names = [...new Set(pairs.flatMap(pair => [pair.first, pair.second]))];
const palette = ['#2563eb', '#0f766e', '#b45309', '#7c3aed', '#be185d', '#0369a1', '#4d7c0f'];
const matrix = names.map(() => names.map(() => 0));
pairs.forEach(pair => { const a = names.indexOf(pair.first), b = names.indexOf(pair.second); matrix[a][b] = matrix[b][a] = pair.value; });
const totals = matrix.map(row => row.reduce((sum, value) => sum + value, 0));
const sum = totals.reduce((total, value) => total + value, 0);
const gap = Math.min(0.04, 0.5 / names.length), scale = (Math.PI * 2 - gap * names.length) / sum;
let angle = 0;
const groups = names.map((name, index) => {
const start = angle;
angle += totals[index] * scale;
const group = { name, index, value: totals[index], start, end: angle, color: palette[index % palette.length] };
angle += gap;
return group;
});
const slots = groups.map((group, index) => {
let current = group.start;
return matrix[index].map(value => { const start = current; current += value * scale; return { start, end: current }; });
});
const point = (angle, radius) => ({ x: Math.sin(angle) * radius, y: Math.cos(angle) * radius });
const arc = (start, end, radius) => {
const count = Math.max(1, Math.ceil(Math.abs(end - start) / (Math.PI / 48)));
return Array.from({ length: count + 1 }, (_, index) => point(start + (end - start) * index / count, radius));
};
const curve = (start, end) => Array.from({ length: 24 }, (_, index) => {
const t = (index + 1) / 24;
return { x: (1 - t) ** 2 * start.x + t ** 2 * end.x, y: (1 - t) ** 2 * start.y + t ** 2 * end.y };
});
const ribbons = pairs.map(pair => {
const a = names.indexOf(pair.first), b = names.indexOf(pair.second), source = slots[a][b], target = slots[b][a];
const points = [...arc(source.start, source.end, 0.86), ...curve(point(source.end, 0.86), point(target.start, 0.86)), ...arc(target.start, target.end, 0.86).slice(1), ...curve(point(target.end, 0.86), point(source.start, 0.86))];
return { name: `${pair.first} / ${pair.second}`, value: pair.value, color: groups[Math.min(a, b)].color, points, kind: 'pair' };
});
const shapes = [...ribbons, ...groups.map(group => ({ ...group, points: [...arc(group.start, group.end, 1), ...arc(group.end, group.start, 0.86)], kind: 'group' }))];
const label = (name) => name.length > 12 ? name.slice(0, 11) + '…' : name;
const text = (shape) => `${shape.name}: ${chartData.connectionHeaders[2]} ${shape.value}${shape.kind === 'group' ? ' (Incident Total)' : ''}`;
const geometry = (chart) => ({ x: (chart.chartArea.left + chart.chartArea.right) / 2, y: (chart.chartArea.top + chart.chartArea.bottom) / 2, radius: Math.max(1, Math.min(chart.chartArea.width / 2 - 80, chart.chartArea.height / 2 - 22)) });
const contains = (points, x, y) => {
let inside = false;
for (let i = 0, j = points.length - 1; i < points.length; j = i++) {
const a = points[i], b = points[j];
if ((a.y > y) !== (b.y > y) && x < (b.x - a.x) * (y - a.y) / (b.y - a.y) + a.x)
inside = !inside;
}
return inside;
};
return {
type: 'scatter', data: { datasets: [{ data: shapes.map(() => ({ x: 0, y: 0 })), pointRadius: 0, pointHoverRadius: 0, pointHitRadius: 0 }] },
options: { responsive: true, maintainAspectRatio: false, animation: false,
scales: { x: { display: false }, y: { display: false } },
plugins: { legend: { display: false }, title: { display: true, text: chartData.connectionHeaders[2] }, tooltip: { callbacks: { title: () => '', label: item => text(shapes[item.dataIndex]) } } },
},
plugins: [{ id: 'chord-polygons', afterDatasetsDraw(chart) {
const { ctx } = chart, center = geometry(chart);
ctx.save();
shapes.forEach(shape => {
ctx.beginPath();
shape.points.forEach((point, index) => {
const x = center.x + point.x * center.radius, y = center.y - point.y * center.radius;
if (index === 0)
ctx.moveTo(x, y);
else
ctx.lineTo(x, y);
});
ctx.closePath();
ctx.fillStyle = shape.color;
ctx.globalAlpha = shape.kind === 'pair' ? 0.5 : 1;
ctx.fill();
});
ctx.globalAlpha = 1;
ctx.fillStyle = '#334155';
ctx.font = '10px sans-serif';
ctx.textBaseline = 'middle';
groups.filter(group => group.end - group.start > 0.22 && groups.length <= 24).forEach(group => {
const position = point((group.start + group.end) / 2, 1.05);
ctx.textAlign = position.x >= 0 ? 'left' : 'right';
ctx.fillText(label(group.name), center.x + position.x * center.radius, center.y - position.y * center.radius, 78);
});
ctx.restore();
}, afterEvent(chart, args) {
const { x, y, type } = args.event, center = geometry(chart);
let index = -1;
if (type !== 'mouseout' && x !== null && y !== null) {
for (let i = shapes.length - 1; i >= 0; i--)
if (contains(shapes[i].points, (x - center.x) / center.radius, (center.y - y) / center.radius)) {
index = i;
break;
}
}
const active = index < 0 ? [] : [{ datasetIndex: 0, index }];
chart.setActiveElements(active);
chart.tooltip?.setActiveElements(active, { x: x ?? 0, y: y ?? 0 });
args.changed = true;
} }],
};
}
const chart = new Chart(document.getElementById('myChart'), createConfig(chartData));Preview and code follow the same library selection.
Run This Example
Install the package below in a browser project such as Vite. Put the copied code in a client JavaScript module and add this container to the page before the module runs.
npm install chart.js@4.5.1<div style="height:320px"><canvas id="myChart"></canvas></div>The example includes its sample data. When removing the chart, destroy or dispose of its instance and disconnect any resize observer.
Reading This Example
These illustrative collaboration counts contain six undirected team pairs totaling 44. Design and Engineering is the largest pair at 12; Support and Research is the smallest at 3. Incident totals are Design 25, Engineering 28, Support 18, and Research 17. Those totals sum to 88 because each pair contributes to two teams. The data does not count unique people or imply that collaboration caused an outcome.
All library tabs use these illustrative values. Rendering styles and library APIs differ, so use the table to compare exact numbers.
About this example & sample data
| First Group | Second Group | Collaborations |
|---|---|---|
| Design | Engineering | 12 |
| Design | Support | 5 |
| Design | Research | 8 |
| Engineering | Support | 10 |
| Engineering | Research | 6 |
| Support | Research | 3 |
READ THE CHART
Compare Connections Around a Circle
A Chord Diagram connects group arcs with ribbons. Wider ribbon ends represent larger pair values. Each outer arc spans the total value of the connections touching that group, helping you compare both individual pairs and group involvement.
Follow Both Ends of a Ribbon
This example uses undirected pairs: Design with Engineering means the same pair as Engineering with Design. Each ribbon has the same value at both ends, with no arrow or implied sender. Enter a pair once; the editor rejects reversed duplicates and self-links. A cycle among several different groups is valid. The ribbon color identifies one endpoint and does not encode direction.
Distinguish Pair Totals From Group Totals
Every pair contributes its value to two group arcs. The total of the outer arcs is therefore twice the sum of the pair values. A group arc shows involvement in the supplied pairs, not an exclusive share of all collaborations. Compare ribbon widths at the circle boundary; the area through the center also depends on curvature and is not a measure of value.
Keep Small and Zero Values Honest
Positive values receive proportional angular spans after small gaps between groups. There is no minimum angle that would enlarge a small connection. Zero pairs remain in the table and copied data without a ribbon; a group with no positive connection has no arc. Dense diagrams can hide or shorten labels, so use the table for exact names and values. Group order follows its first positive appearance; ribbon attachment order can differ by library.
Choose a View That Matches the Question
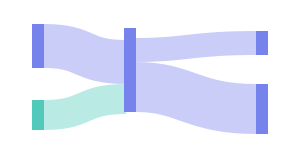
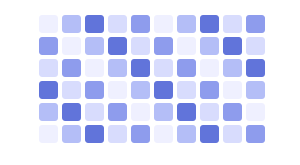
Chord works best when the main task is comparing connections among a manageable number of groups. A Heatmap makes exact pair patterns easier to scan when ribbons overlap heavily. Use a Sankey Diagram for directed movement through stages. The Chart.js and Plotly examples calculate their own ribbon geometry. D3 and ECharts provide native chord support. Both Python examples draw calculated polygons with Matplotlib, with Seaborn supplying the theme in its tab.
KEEP EXPLORING