Distribution / Intermediate
Beeswarm Plot
Show every observation while separating overlapping values within groups.
Interactive Chart Preview
JAVASCRIPTEdit the column names and values to update your chart. Changes stay in this page until you reload.
| Row# | Observation Group | Individual Value | Remove row |
|---|---|---|---|
| 1 | |||
| 2 | |||
| 3 | |||
| 4 | |||
| 5 | |||
| 6 | |||
| 7 | |||
| 8 | |||
| 9 | |||
| 10 | |||
| 11 | |||
| 12 | |||
| 13 | |||
| 14 | |||
| 15 | |||
| 16 | |||
| 17 | |||
| 18 | |||
| 19 | |||
| 20 | |||
| 21 | |||
| 22 | |||
| 23 | |||
| 24 |
Enter one individual observation per row. Repeated values remain separate observations; group names are case-sensitive.
Chart.js Code Example
JAVASCRIPTimport Chart from 'chart.js/auto';
// Illustrative data used by the live preview.
const chartData = {
"observationHeaders": [
"Channel",
"Minutes"
],
"observations": [
{
"group": "Email",
"value": 4
},
{
"group": "Email",
"value": 5
},
{
"group": "Email",
"value": 6
},
{
"group": "Email",
"value": 6
},
{
"group": "Email",
"value": 7
},
{
"group": "Email",
"value": 8
},
{
"group": "Email",
"value": 9
},
{
"group": "Email",
"value": 9
},
{
"group": "Email",
"value": 10
},
{
"group": "Email",
"value": 12
},
{
"group": "Email",
"value": 14
},
{
"group": "Email",
"value": 18
},
{
"group": "Chat",
"value": 2
},
{
"group": "Chat",
"value": 2
},
{
"group": "Chat",
"value": 3
},
{
"group": "Chat",
"value": 3
},
{
"group": "Chat",
"value": 4
},
{
"group": "Chat",
"value": 4
},
{
"group": "Chat",
"value": 5
},
{
"group": "Chat",
"value": 5
},
{
"group": "Chat",
"value": 6
},
{
"group": "Chat",
"value": 7
},
{
"group": "Chat",
"value": 8
},
{
"group": "Chat",
"value": 10
}
],
"datasets": []
};
function createConfig(chartData) {
const observations = chartData.observations;
const groups = [...new Set(observations.map(item => item.group))];
const palette = ['#2563eb', '#0f766e', '#b45309', '#7c3aed', '#be185d'];
const values = observations.map(item => item.value), low = Math.min(...values), high = Math.max(...values);
const padding = high > low ? (high - low) * 0.08 : Math.max(1, Math.abs(low) * 0.05);
const minimum = low - padding, maximum = high + padding;
const counts = groups.map(group => observations.filter(item => item.group === group).length);
// Merge forbidden offsets, then choose the nearest free position to the band center.
function swarm(xPixels, band) {
let radius = Math.min(4, band * 0.35);
for (let attempt = 0; attempt < 64; attempt++) {
const points = [];
groups.forEach((group, groupIndex) => {
const rows = observations.map((item, row) => ({ item, row })).filter(({ item }) => item.group === group).sort((a, b) => xPixels[a.row] - xPixels[b.row] || a.row - b.row);
const placed = [];
const distance = radius * 2.2;
rows.forEach(({ row }) => {
const x = xPixels[row];
const intervals = placed.filter(point => Math.abs(point.x - x) < distance).map(point => {
const delta = Math.sqrt(Math.max(0, distance ** 2 - (point.x - x) ** 2));
return [point.offset - delta, point.offset + delta];
}).sort((a, b) => a[0] - b[0]);
const merged = [];
intervals.forEach(interval => {
const last = merged.at(-1);
if (last && interval[0] <= last[1])
last[1] = Math.max(last[1], interval[1]);
else
merged.push([...interval]);
});
const blocked = merged.find(interval => interval[0] < 0 && interval[1] > 0);
const offset = blocked ? (Math.abs(blocked[0]) <= Math.abs(blocked[1]) ? blocked[0] : blocked[1]) : 0;
placed.push({ x, offset });
points.push({ row, x, offset, group: groupIndex });
});
});
if (points.every(point => Math.abs(point.offset) + radius <= band * 0.42))
return { radius, points: points.sort((a, b) => a.row - b.row) };
radius *= 0.75;
}
throw new Error('The swarm could not fit its drawing area.');
}
let pointRadius = 4;
return {
type: 'scatter', data: { datasets: [{ data: observations.map(item => ({ x: item.value, y: groups.indexOf(item.group) })), backgroundColor: observations.map(item => palette[groups.indexOf(item.group) % palette.length]), pointBorderWidth: 0, pointRadius: () => pointRadius, pointHoverRadius: () => pointRadius }] },
plugins: [{ id: 'deterministic-swarm', afterDatasetsUpdate: chart => {
const band = Math.max(1, chart.chartArea.height) / groups.length;
const layout = swarm(values.map(value => chart.scales.x.getPixelForValue(value)), band);
pointRadius = layout.radius;
const elements = chart.getDatasetMeta(0).data;
layout.points.forEach(point => {
const element = elements[point.row];
element.x = point.x;
element.y = chart.scales.y.getPixelForValue(point.group) + point.offset;
element.options = { ...element.options, radius: layout.radius, hoverRadius: layout.radius, borderWidth: 0 };
});
} }],
options: { animation: false, responsive: true, maintainAspectRatio: false,
scales: {
x: { type: 'linear', min: minimum, max: maximum, title: { display: true, text: chartData.observationHeaders[1] } },
y: { min: -0.5, max: groups.length - 0.5, reverse: true, afterBuildTicks: scale => { scale.ticks = groups.map((_, value) => ({ value })); }, ticks: { callback: value => groups[Number(value)] !== undefined ? `${groups[Number(value)].slice(0, 14)} (n=${counts[Number(value)]})` : '' }, title: { display: true, text: chartData.observationHeaders[0] }, grid: { display: false } },
},
plugins: { legend: { display: false }, title: { display: true, text: 'One Dot per Observation' }, tooltip: { callbacks: { label: item => { const observation = observations[item.dataIndex]; return `${observation.group}: ${observation.value} (row ${item.dataIndex + 1})`; } } } }, },
};
}
const chart = new Chart(document.getElementById('myChart'), createConfig(chartData));Preview and code follow the same library selection.
Run This Example
Install the package below in a browser project such as Vite. Put the copied code in a client JavaScript module and add this container to the page before the module runs.
npm install chart.js@4.5.1<div style="height:320px"><canvas id="myChart"></canvas></div>The example includes its sample data. When removing the chart, destroy or dispose of its instance and disconnect any resize observer.
Reading This Example
These illustrative response times contain 12 Email and 12 Chat observations, matching the Density and Violin examples. Email includes repeated values at 6 and 9 minutes; Chat repeats 2, 3, 4, and 5. Each repeat remains a separate dot. Email ranges from 4 to 18 minutes and Chat from 2 to 10.
All library tabs use these illustrative values. Rendering styles and library APIs differ, so use the table to compare exact numbers.
About this example & sample data
| Channel | Minutes |
|---|---|
| 4 | |
| 5 | |
| 6 | |
| 6 | |
| 7 | |
| 8 | |
| 9 | |
| 9 | |
| 10 | |
| 12 | |
| 14 | |
| 18 | |
| Chat | 2 |
| Chat | 2 |
| Chat | 3 |
| Chat | 3 |
| Chat | 4 |
| Chat | 4 |
| Chat | 5 |
| Chat | 5 |
| Chat | 6 |
| Chat | 7 |
| Chat | 8 |
| Chat | 10 |
READ THE CHART
Keep Every Observation Visible
A beeswarm plot places each observation on its measured coordinate and separates nearby dots across the other direction. It is useful when you want to inspect the values behind a distribution, especially in a small sample with repeated measurements.
Read the Measurement Along the Horizontal Axis
Each dot represents one row from the table. Its horizontal position is the supplied value on a shared numeric scale. The vertical band identifies its group. Movement above or below that group center only prevents overlap; it is not another measured variable. Repeated values remain separate dots at the same horizontal coordinate.
Keep Group Size Separate From Dot Size
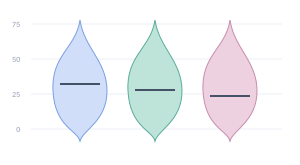
All dots in one rendering have the same radius. The labels include the number of observations in each group. More dots can make a swarm look thicker, but thickness is not a normalized density estimate. Unlike the Violin Plot, this chart does not estimate a smooth population shape or add median marks.
Allow Room for Repeated Values
This example places values in ascending order, keeping table order for ties, and chooses the nearest available vertical position in the group. It uses no random jitter. If dots would exceed a group band, it reduces the common radius until every observation fits. Dense samples can produce very small dots; the table and copied data retain every row. Single observations and constant groups are valid.
Expect Layout Changes When the Chart Resizes
Spacing depends on the available drawing area. A different width can change vertical placement while each measured coordinate remains unchanged. Chart.js, ECharts, and Plotly recalculate placement when their container changes; the D3 SVG scales uniformly. Plotly keeps its axes fixed so zooming cannot invalidate dot spacing. All six examples use explicit deterministic placement. Seaborn draws those calculated positions with scatterplot instead of applying its own swarmplot algorithm.
KEEP EXPLORING